In this chapter, we will look at the performance of some key parameters and, where applicable, compare them with an original UMC202HD and an Audio Precision Portable One Plus. These key parameters include:
- THD, harmonics
- EIN
- CMRR and RF sensitivity
- Frequency response
- DVM error
THD and harmonics
As you can read in the chapter about the UMC202HD modifications, the THD of this audio interface can be improved considerably. Not only at high input levels, but even at input levels of -6 dBFs or lower, the THD can be made an order of magnitude lower. In particular, the third harmonic will drop considerably. I have summarised the results of the THD improvements in the table below. These were measured via a loopback connection from the generator output of the analyzer (aka line output) to one of the analyzer inputs (aka line input). The input selector was set to 200 mV, which yields a -3 dBFs level at the 200 mV input signal. Distortion plots are shown further down below.

Harmonic Distortions of the UMC202HD, Audio Analyzer, and Mackie ProFX12 at various input levels
From the table, it is quite obvious that the UMC202HD has by far the highest HD, and the Mackie is a good runner-up. The UMC202HD harmonic distortion levels at -3 dBs would not be audible, so for an audio interface, this could be acceptable. But we are talking here about its use as a measuring instrument. Then you just want the lowest distortion levels possible.
Being a loopback test, without using a notch filter to suppress the fundamental frequency, I was not able to determine the distortion levels of the inputs and outputs individually. This means that the actual distortion levels of inputs and outputs will be the same or lower than those listed in the table above. Anyway, the figures will be quite close to those of an RME Babyface Pro FS, costing 9 times as much and for which you would still need to build a frontend solution adding noise and distortion. Not bad at all! FYI: The THD of a Babyface Pro FS is specified at max -112 dB (0.00024%) on the inputs and max -106 dB (0.0005%) on the outputs. Unfortunately, they did not specify the level at which these figures were measured, nor whether this was determined at the “sweet spot” where THD was the lowest.
I won’t show all the distortion plots of all the measurements listed in the table above, but I’ll list some plots of the original UMC202HD versus the Audio Analyzer with the modified UMC202HD. The differences are quite obvious.
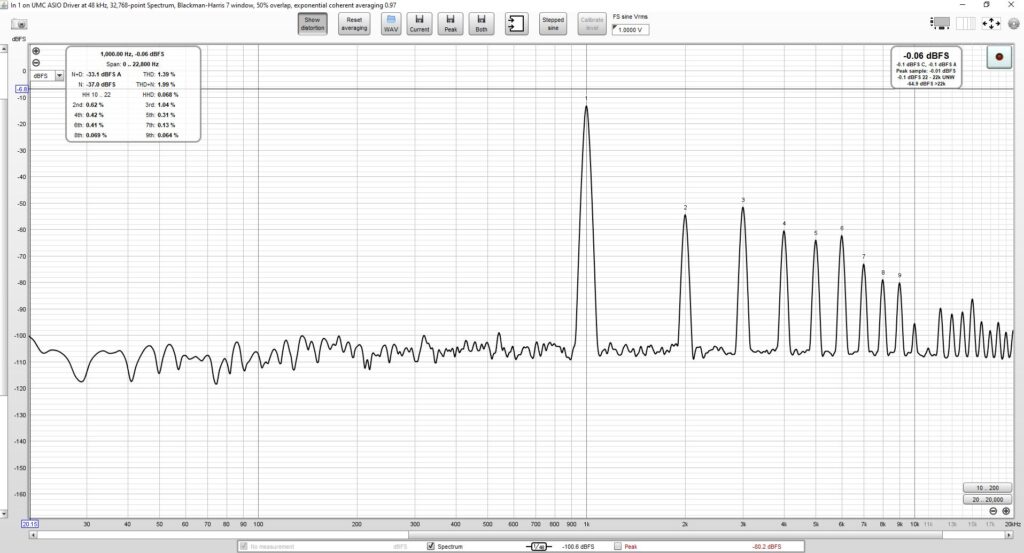
Original UMC202HD at 0 dBFs input signal level. Severe distortion.
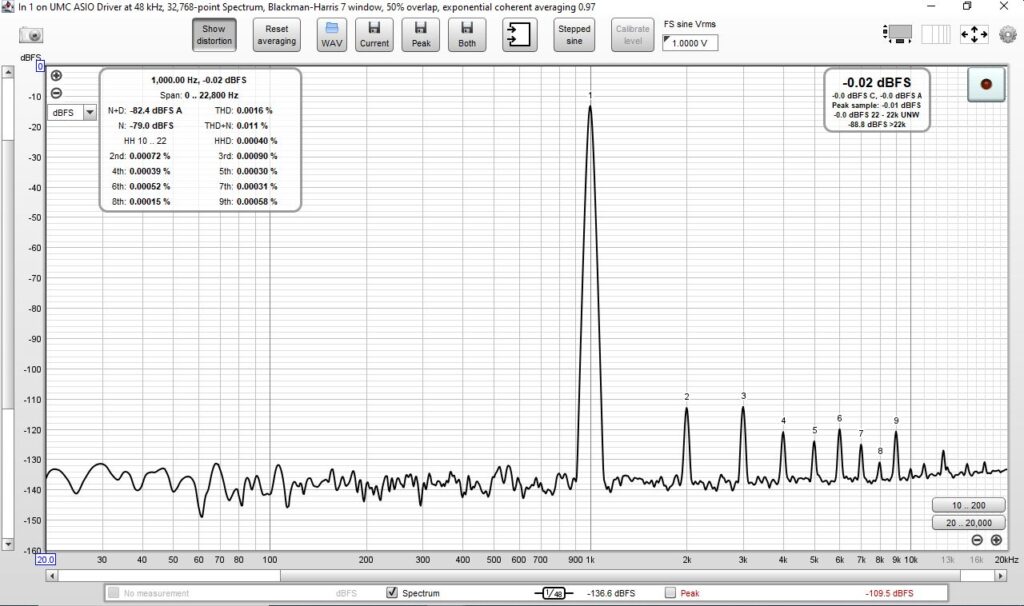
Audio Analyzer at 0 dBFs input level. Significantly lower distortion compared to the UMC202HD.
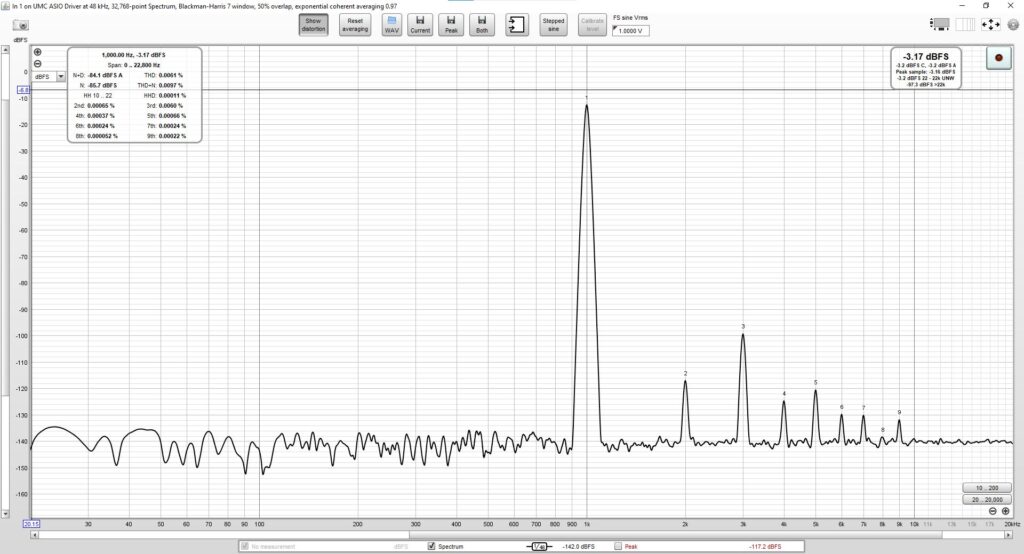
UMC202HD at -3 dBFs. Still quite some distortion.
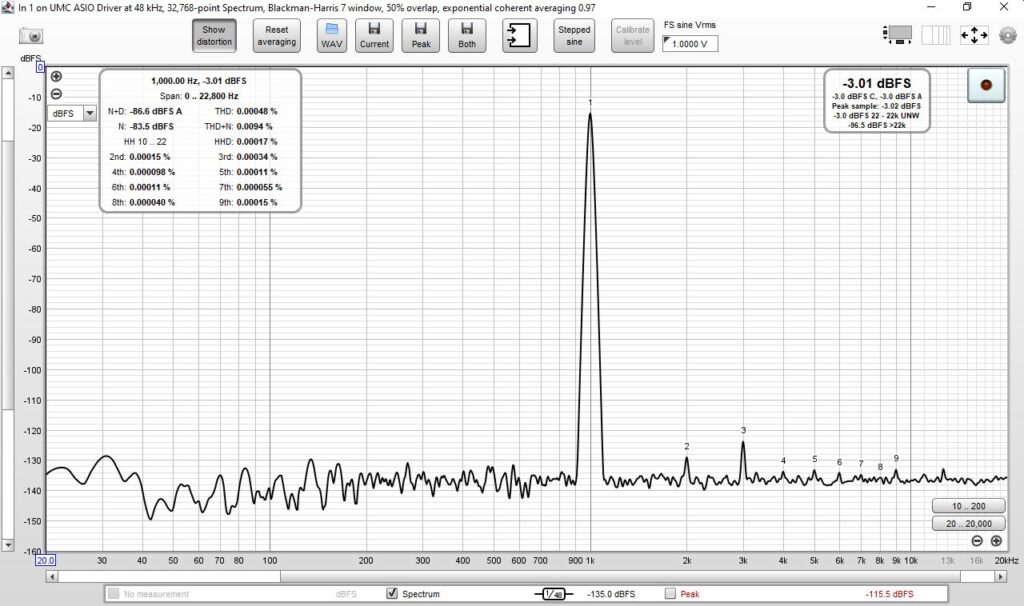
Analyzer at -3 dBFS input signal. Distortion is still an order of magnitude lower compared to the UMC202HD.
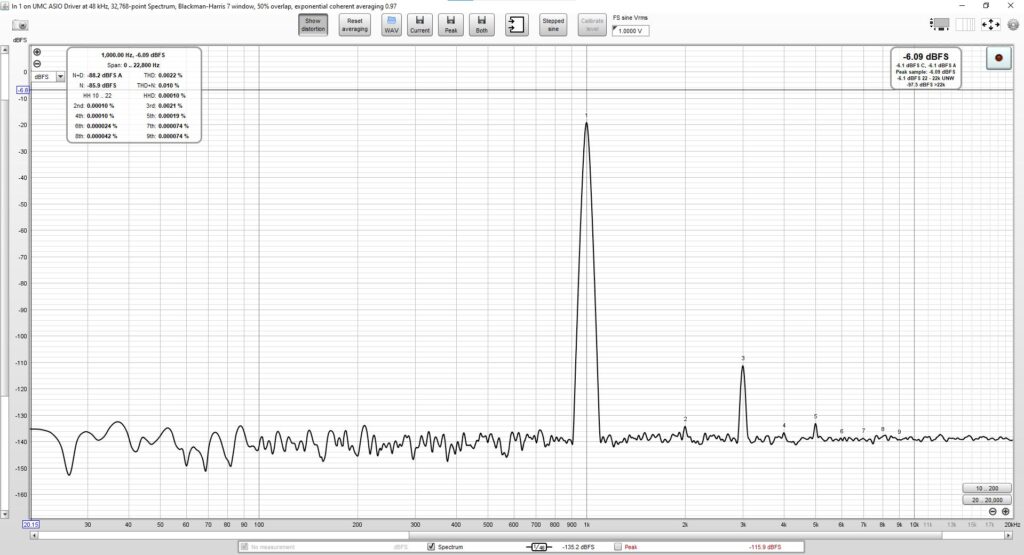
UMC202HD distortion level at -6 dBFs. HD3 level remains high, probably due to low Vdd of Codec chip.

At -6 dBFs, harmonics are almost drowned out by the noise floor. The small peak at 12.5 kHz is not a harmonic but an anomaly from the Analyzer with an unknown root cause.
Equivalent Input Noise
Another important property of an audio analyzer is the preamp self-noise contribution to the measured signal, which, of course, should be as low as possible. The noise contribution of a preamp is generally called the equivalent input noise, abbreviated EIN. You can read more about the EIN here. By measuring the EIN of the UMC202HD and of the Audio Analyzer, we can verify whether all the modifications made sense and whether the design meets the requirement of equal or lower noise than the UMC202HD noise level.
I measured the EIN of the microphone input at 2 mV sensitivity and the line input at 200 mV sensitivity. EIN is usually expressed in dBu or dBV. Personally, I prefer dBV, but I will use dBu here as it seems to be more common. To measure EIN, I first calibrated the level in the REW RTA window using a signal from the REW generator output and the built-in True RMS DVM of my analyzer. After calibration, I stopped the REW generator and removed the loopback XLR cable. I then inserted an XLR plug in the input with the desired reference impedance between pins 2 and 3 (0R or 150R).
I followed the same procedure for the UMC202HD, but as it does not have calibrated gain settings, I first had to adjust the input gain pot until I obtained the same dBFs readings for the Analyzer and the UMC202HD. I then calibrated the REW RTA level. The results are in the table below. Both the unweighted dBu and A-weighted dBu values are listed. As you can see, the audio analyzer performs about 2 to 3 dBu (A) better compared to the UMC202HD.
As a reference, I also connected a mic preamp of my Mackie ProFX12 (V1) to the audio analyzer line input and level adjusted the gain on the ProFX12 until I obtained the same level as on the 2 mV mic input of the analyzer. From the measurement data, we can read that the Mackie preamp and the Audio Analyzer preamp are on par in terms of noise level.

EIN of the mic inputs of the UMC202HD, Audio Analyzer, and Mackie ProFX12 (through the Audio Analyzer 200mV Line Input).
CMRR and RF sensitivity
A property that is not always taken notice of when comparing preamps is the CMRR (Common Mode Rejection Ratio). In many cases, it is not even published for Audio Interfaces, perhaps because this is too difficult or an unknown concept for the average consumer. Mains hum generated in ground loops is the most well-known example of such common mode signals, but also RF signals from strong radio transmitters (nearby cell phones!) can enter the preamp/Analyzer as a common mode signal and wreak havoc on your delicate measuring signal. I have measured the CMRR over the entire audio band (see the download file with REW measurements) and summarised them below. For the CMRR measurements, I used the method described here.
With an RF Signal Injector that can inject 500 – 1200 MHz RF signals into an XLR cable, I also checked the sensitivity of frequencies from cell phones. With this RF jammer, I was able to get AM demodulation in some microphones at levels that, judged by the ear, were quite similar to what you would get from a cell phone held close to the microphone cable. For my Analyzer, I found RF immunity less important compared to the 50Hz CMRR, because RF interference would only come in bursts from my cell phone. This interference source can be eliminated quite easily by turning the phone off, but this is not the case for 50Hz/60Hz power line hum.
In the first of the two tables below, I listed the measured CMRR levels at 50 Hz and 20 kHz. The second table lists the worst-case AM demodulation levels in the 500 MHz to 1.2 GHz range as measured with the RF injector circuit. Please note: the AM detection levels listed can only be compared with each other because no standardized measuring method with calibrated measuring equipment has been used. CMRR figures are quite good indeed and exceed the 80 dB requirement of the R&S UPL Audio Analyzer. And if you go by the standards of cable manufacturer Belden, the audio band CMRR values would be in the range of Excellent to World Class. The Mackie would score Average to Good.

CMRR values, as measured by injecting a 1V RMS common-mode signal into the inputs.

RF sensitivity comparison
Although the Analyzer Mic Input sensitivity for RF signals seems quite poor compared to the other signal inputs, it is still usable. But I have to admit that the input filter circuits are less effective than I had expected. Perhaps I should have added a CM inductor in the microphone signal line, directly on the XLR input, instead of the beads and filter caps on the PCBA. The RF signal injector box has this in the output to the mixer, and it works very effectively.
Frequency Response
Frequency Response measurements were done by looping back the Line Out to the Mic and Line Inputs. I set the output impedance to 50 Ohm, the Line Input to 200 mV sensitivity and the Mic Input to Variable with max gain and 3 kOhm input impedance. I did not measure the UMC202HD FR, but I did measure the Mackie ProFX12 preamp, of which I wired the Insert output to the Line Input of the Audio Analyzer. See the plot further down. The Mackie preamp gain was set to ~100 to match the sensitivity of the 2mV Mic input of the Audio Analyzer. The gains had to be made more or less equal as the bandwidth is a function of the gain with many Mic Preamp circuits. I was unable to set the gain of the Mackie to exactly 100 because, in the 30-60 dB gain range, it is practically impossible to adjust the gain pot with better than +/- 2 dB accuracy. Anyway, from the Mackie FR plot, we can conclude the low-end response is far from flat: at 20 Hz, the gain is about 3.4 dB down from 1 kHz. This might be acceptable for audio purposes, but not for an audio measurement instrument.
As described in the Line Output circuit description, the loopback Frequency Response depends slightly on the setting of the output level potmeters. So I took measurements at 200mV output level through the Mic input and Line Input at 200 mV sensitivity and another measurement at 2V output level through the Mic input at 5V sensitivity. The 200 mV signal is flat within +/-0.1 dB between 20 Hz and 2 kHz and rises +0.3 dB at 20 kHz. Again, at 2 V, it is flat within +/-0.1 dB between 20 Hz and 2 kHz but now drops 0.2 dB at 20 kHz. On the plots, the deviations seem quite significant, but the FR is good enough for me. It does not meet my wish for +/- 0.1 dB flatness, but it is within the +/- 0.5 dB range, which I set as a minimal requirement.
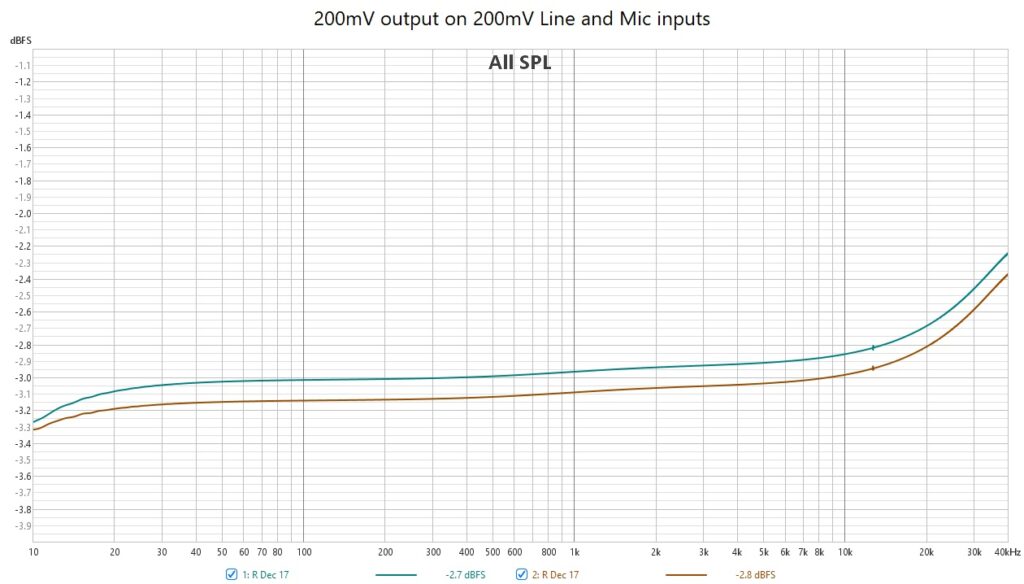
FR of Mic Preamp (blue) and Line-Input (orange) at 200 mV setting.
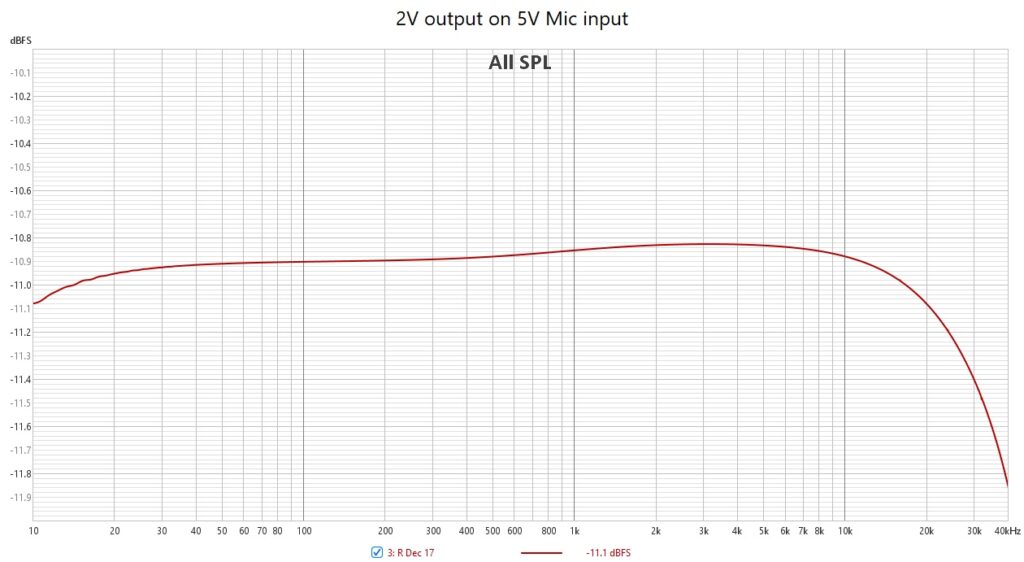
2 V Line-Out level to 5V Mic Preamp input.
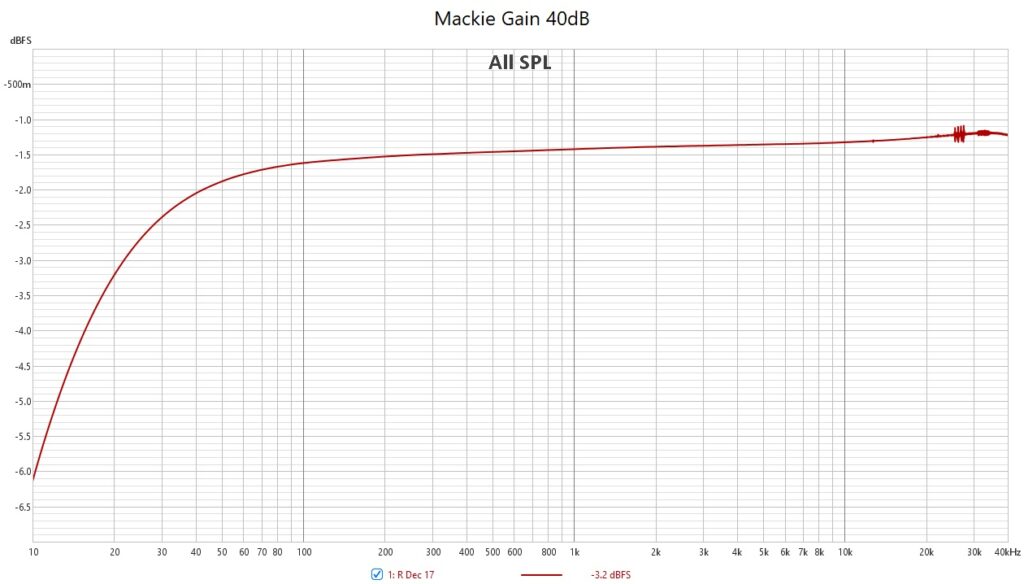
Mackie Mic Preamp response (Preamp Insert wired to Audio Analyzer Line-Input, 200 mV scale).
DVM accuracy
The True RMS Digital Volt Meter was calibrated using a 6 1/2 digit calibrated Digital Multi Meter, so this should guarantee accurate measurements. At least, that was what I expected… But I measured the accuracy again about 6 months later, and I was somewhat disappointed. With most settings of the Input Selectors, the accuracy was spot-on or at least within 1%, but with some settings, the deviation was much too high. See the table below. I have yet to figure out the root cause, but I’m afraid I will have to re-calibrate the DVM. Maybe I made some typos when entering the values from the DMM. All measurements were done with a 1 kHz sine wave, by the way.
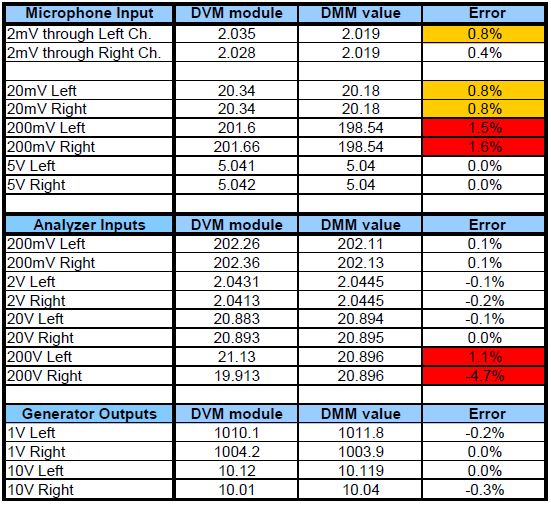
True RMS DVM accuracy on all channels and settings.
I also checked the accuracy as a function of frequency for the Left Line Input channel at 2V sensitivity and a 1V RMS sine wave input. I measured at 20 Hz, 200 Hz, 2 kHz and 20 kHz. At 20 Hz, the deviation was -1.2%, at 200 Hz and 2 kHz -0.1% and at 20 kHz it was rising sharply to +12%.
More…
Of course, there are many more features you can specify, but I’ll leave it at this for now.